Traders Flee Largest Emerging-Debt ETF on Omicron, Fed-Hike Bets
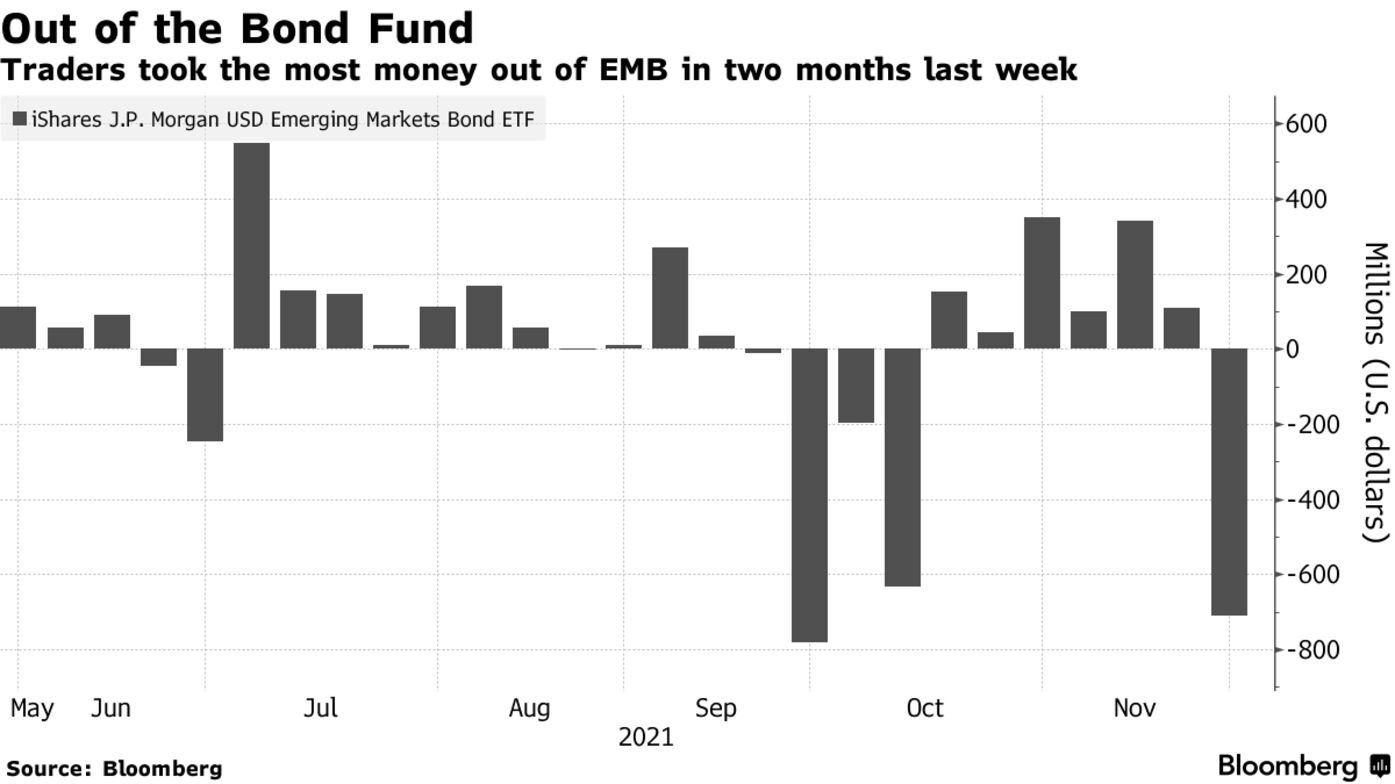
By- EMB lost $709.5 million last week, worst outflow in two months
- Most withdrawals came a day after Powell’s Fed renomination
The double whammy of a new coronavirus variant and prospects of tighter policy in the U.S. had investors rethinking their appetite for risky emerging-market bonds last week.
The $19 billion iShares J.P. Morgan USD Emerging Markets Bond ETF (EMB) lost $709.5 million in investment in the week ended Nov. 26, the biggest outflow in two months, according to data compiled by Bloomberg. It could mark a turning point for the biggest U.S.-based exchange-traded fund dedicated to emerging debt, which ended six-straight weeks of gains as demand for risk faded. Those withdrawals coincided with a 2.6% drop in the ETF, the worst week since March 2020. The shares were up 0.8% on Monday.
Most of the withdrawals came Tuesday, a day after Federal Reserve Chair Jerome Powell was tapped for a second term, which led investors to bet on a faster pace of monetary tightening. The rest came at the end of the week, as U.S. investors returned from the Thanksgiving holiday to concern surrounding the omicron strain leading to travel bans an widespread market losses.
“We can’t see a positive environment for EM, as many EM countries will be last in line for vaccine that might be produced to counteract” the variant, Citigroup Inc. strategists Jamie Fahy, Adam Pickett and Yasmin Younes wrote in a note to clients Friday.
In the week ended Nov. 26, traders pulled a total of $854.1 million from U.S.-listed exchange-traded funds that buy across developing nations as well as those that target specific countries, according to data compiled by Bloomberg.
Click here for Bloomberg’s ETF screening applications.
Following are tables detailing net flows for emerging-market ETFs in U.S. dollars. The data include the holdings-weighted allocations from multi-country funds, as well as country-specific funds (figures in USD millions unless otherwise stated):
Regional Summary
| REGION | FLOW WEEK | EQUITY FLOW | BOND FLOW | TOTAL ASSETS (USD BLN) |
|---|---|---|---|---|
| Total EM | -854.1 | -213.9 | -640.2 | 335.3 |
| Americas | -256.5 | -53.8 | -202.7 | 34.3 |
| Asia Pac | -319.7 | -204.4 | -115.3 | 249.1 |
| EMEA | -277.9 | 44.2 | -322.2 | 51.9 |
Click here for Bloomberg’s ETF Excel library.
Americas
| COUNTRY | FLOW WEEK | EQUITY FLOW | BOND FLOW | TOTAL ASSETS |
|---|---|---|---|---|
| Mexico | -114.7 | -74.9 | -39.8 | 7,615.5 |
| Colombia | -21.6 | 0.2 | -21.8 | 1,674.6 |
| Panama | -21.2 | 0.0 | -21.2 | 732.9 |
| Peru | -18.8 | 4.2 | -23.0 | 1,421.5 |
| Brazil | -18.1 | 5.2 | -23.2 | 17,948.2 |
| Uruguay | -15.7 | 0.0 | -15.7 | 713.7 |
| Ecuador | -11.6 | 0.0 | -11.6 | 346.8 |
| Argentina | -10.3 | -1.2 | -9.0 | 527.6 |
| Chile | -9.0 | 12.8 | -21.8 | 2,692.3 |
| Jamaica | -6.0 | 0.0 | -6.0 | 181.5 |
| Paraguay | -3.8 | 0.0 | -3.8 | 197.6 |
| Costa Rica | -3.7 | 0.0 | -3.7 | 190.8 |
| Trinidad & Tobago | -1.0 | 0.0 | -1.0 | 42.0 |
| Bolivia | -0.9 | 0.0 | -0.9 | 28.4 |
| Venezuela | -0.3 | 0.0 | -0.3 | 8.8 |
| Belize | 0.0 | 0.0 | 0.0 | 0.7 |
Asia Pacific
| COUNTRY | FLOW WEEK | EQUITY FLOW | BOND FLOW | TOTAL ASSETS |
|---|---|---|---|---|
| South Korea | -121.5 | -121.5 | 0.0 | 22,543.2 |
| Taiwan | -63.4 | -63.4 | 0.0 | 47,865.4 |
| Indonesia | -43.2 | -7.6 | -35.7 | 5,970.0 |
| China/Hong Kong | -39.2 | -32.0 | -7.2 | 114,225.6 |
| Philippines | -25.9 | -0.6 | -25.3 | 3,055.4 |
| Kazakhstan | -14.2 | 0.0 | -14.2 | 519.5 |
| Malaysia | -14.2 | 1.7 | -15.9 | 5,259.3 |
| Sri Lanka | -6.3 | 0.0 | -6.3 | 267.7 |
| Pakistan | -5.4 | 0.1 | -5.5 | 358.9 |
| Vietnam | -1.1 | 0.0 | -1.1 | 752.5 |
| Mongolia | -0.1 | 0.0 | -0.1 | 44.7 |
| Bangladesh | 0.0 | 0.0 | 0.0 | 30.9 |
| Thailand | 2.7 | 2.7 | 0.0 | 6,278.4 |
| India | 12.0 | 16.1 | -4.1 | 41,898.2 |
Europe, Middle East & Africa
| COUNTRY | FLOW WEEK | EQUITY FLOW | BOND FLOW | TOTAL ASSETS |
|---|---|---|---|---|
| Qatar | -30.3 | 1.1 | -31.3 | 3,047.2 |
| U.A.E. | -25.9 | 1.3 | -27.2 | 3,188.2 |
| Saudi Arabia | -23.8 | 5.3 | -29.1 | 9,803.2 |
| Oman | -21.9 | 0.0 | -21.9 | 790.6 |
| Bahrain | -19.6 | 0.1 | -19.7 | 780.0 |
| Egypt | -19.3 | 0.2 | -19.4 | 977.8 |
| Ukraine | -16.0 | 0.0 | -16.0 | 560.4 |
| Turkey | -14.7 | 13.9 | -28.5 | 2,682.5 |
| South Africa | -14.5 | 5.7 | -20.2 | 9,351.7 |
| Nigeria | -13.1 | 0.0 | -13.1 | 564.2 |
| Hungary | -11.7 | 0.4 | -12.1 | 1,211.9 |
| Ghana | -9.2 | 0.0 | -9.2 | 284.5 |
| Romania | -8.7 | 0.0 | -8.7 | 674.6 |
| Kenya | -6.7 | 0.0 | -6.7 | 311.9 |
| Greece | -6.2 | -6.2 | 0.0 | 771.4 |
| Poland | -5.7 | 0.5 | -6.1 | 1,796.2 |
| Russia | -4.6 | 21.0 | -25.5 | 11,794.6 |
| Jordan | -4.5 | 0.0 | -4.5 | 212.7 |
| Kuwait | -4.0 | 1.0 | -5.0 | 1,730.7 |
| Croatia | -3.4 | 0.0 | -3.4 | 102.4 |
| Iraq | -3.1 | 0.0 | -3.1 | 94.1 |
| Morocco | -2.2 | 0.0 | -2.2 | 217.9 |
| Senegal | -2.1 | 0.0 | -2.1 | 64.8 |
| Zambia | -1.8 | 0.0 | -1.8 | 53.1 |
| Ivory Coast | -1.3 | 0.0 | -1.3 | 46.2 |
| Serbia | -1.1 | 0.0 | -1.1 | 115.1 |
| Lebanon | -1.0 | 0.0 | -1.0 | 34.0 |
| Gabon | -1.0 | 0.0 | -1.0 | 34.3 |
| Tunisia | -0.8 | 0.0 | -0.8 | 24.2 |
| Lithuania | 0.0 | 0.0 | 0.0 | 2.1 |
| Slovenia | 0.0 | 0.0 | 0.0 | 0.4 |
| Mauritius | 0.0 | 0.0 | 0.0 | 39.3 |
| Mozambique | 0.0 | 0.0 | 0.0 | 1.9 |
| Czech Republic | 0.2 | 0.2 | 0.0 | 542.3 |
This story was produced with the assistance of Bloomberg Automation.


Keine Kommentare:
Kommentar veröffentlichen